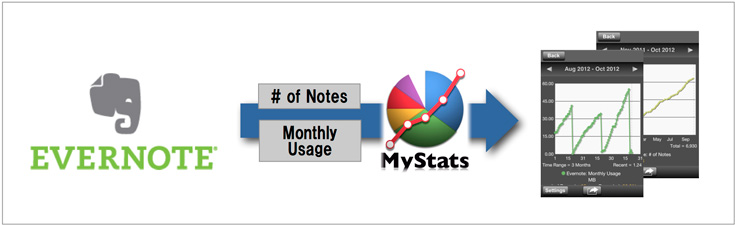
NEOREX Co., Ltd. announced today that a new function called Evernote Analysis has been added to MyStats, an iPhone app for self-management.
With this new function, users can get information about "# of Notes" and "Monthly Usage" from Evernote® automatically, and visualize them with Line Graphs.
This new function came about in a brainstorming meeting with Evernote management and Kenji (Creator of MyStats), which took place during a visit to Evernote headquarters in Silicon Valley.
Before this latest version MyStats solely visualized manually-input-data. The Evernote Analysis became the first external data handling function of MyStats.
<What’s MyStats?>
MyStats is a free iPhone app for self-management. It was developed based on the time management concepts of Peter F. Drucker.
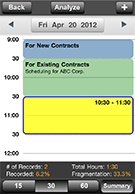
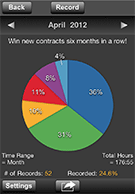
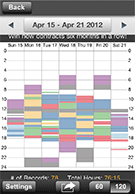
With this app, you can record "when and what you did" and visualize "how you are spending your time" by using pie charts. This function is called the "Timed Activity".
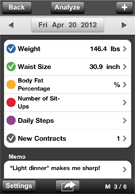
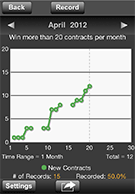
With another function, called "Daily Activity", you can define any activities, such as "Today's New Contracts" or "Today's Weight", and then record and visualize them with the use of line graphs.
Since MyStats launched on April 20th 2011, more than 100,000 copies have been downloaded in 74 countries and regions worldwide.
MyStats is available for the iPhone family (iPhone, iPod touch and iPad).
<Screenshots>
<Overview of Evernote Analysis>
 |
|
 |
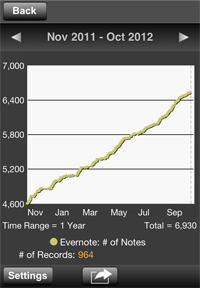
| <# of Notes> |
|
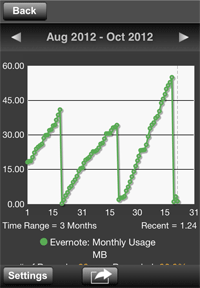
<Monthly Usage> |
You can add "# of Notes" and "Monthly Usage" as new Daily Activities.
With "# of Notes", you can see how your Evernote notes have increased since you started using Evernote until now, on a Line graph.
With "Monthly Usage", you can see how much data you upload to Evernote each month.
<What's Good About Visualizing Monthly Usage on a Line Graph>
Although Evernote doesn't limit the total amount of data you can store, the total amount of data you can upload in a month is limited.
Therefore, for Evernote users, it is important to know how much more can be uploaded in a month, or how much they uploaded in the last month, and so on.
Current Monthly Usage can be reviewed at anytime through a function which Evernote provides. However, past data, like yesterday or last month, is not available.
So we have developed the Evernote Analysis function. With this function, users now can automatically and continually record and visualize the Monthly Usage whenever they open MyStats to record their time, weight or any personal data with MyStats.
Though this function is a rather simple one, we believe that it has big potential value for Evernote users.
<Plans For The Near Future>
For the Evernote Analysis function, we look forward to listening to user's voices and consider adding other analysis functions.
Additionally, starting with the Evernote Analysis function, we're considering importing data from other external services and products, such as running results, weight, and so on.
<About Evernote>
Evernote is helping the world remember everything by building innovative products and services that allow individuals to capture, find and interact with their memories. Evernote apps are available on all major computer, web, mobile, and tablet platforms. For more information, please visit: www.evernote.com
<Contacts>
Ben Watanabe, International Outreach
ben@mystats.net
+81-52-681-2121
Website:
App Store:
Facebook:
Twitter:
Blog:
*All brand names, product names, or trademarks belong to their respective holders.
|